
Understanding the drivers of health care trends within a large employee population can be difficult, especially among remote and hybrid workforces. A new pilot study shows that the Evernorth Vitality Index (EVI) can provide insight and identify underlying factors that facilitate targeted engagement and support.
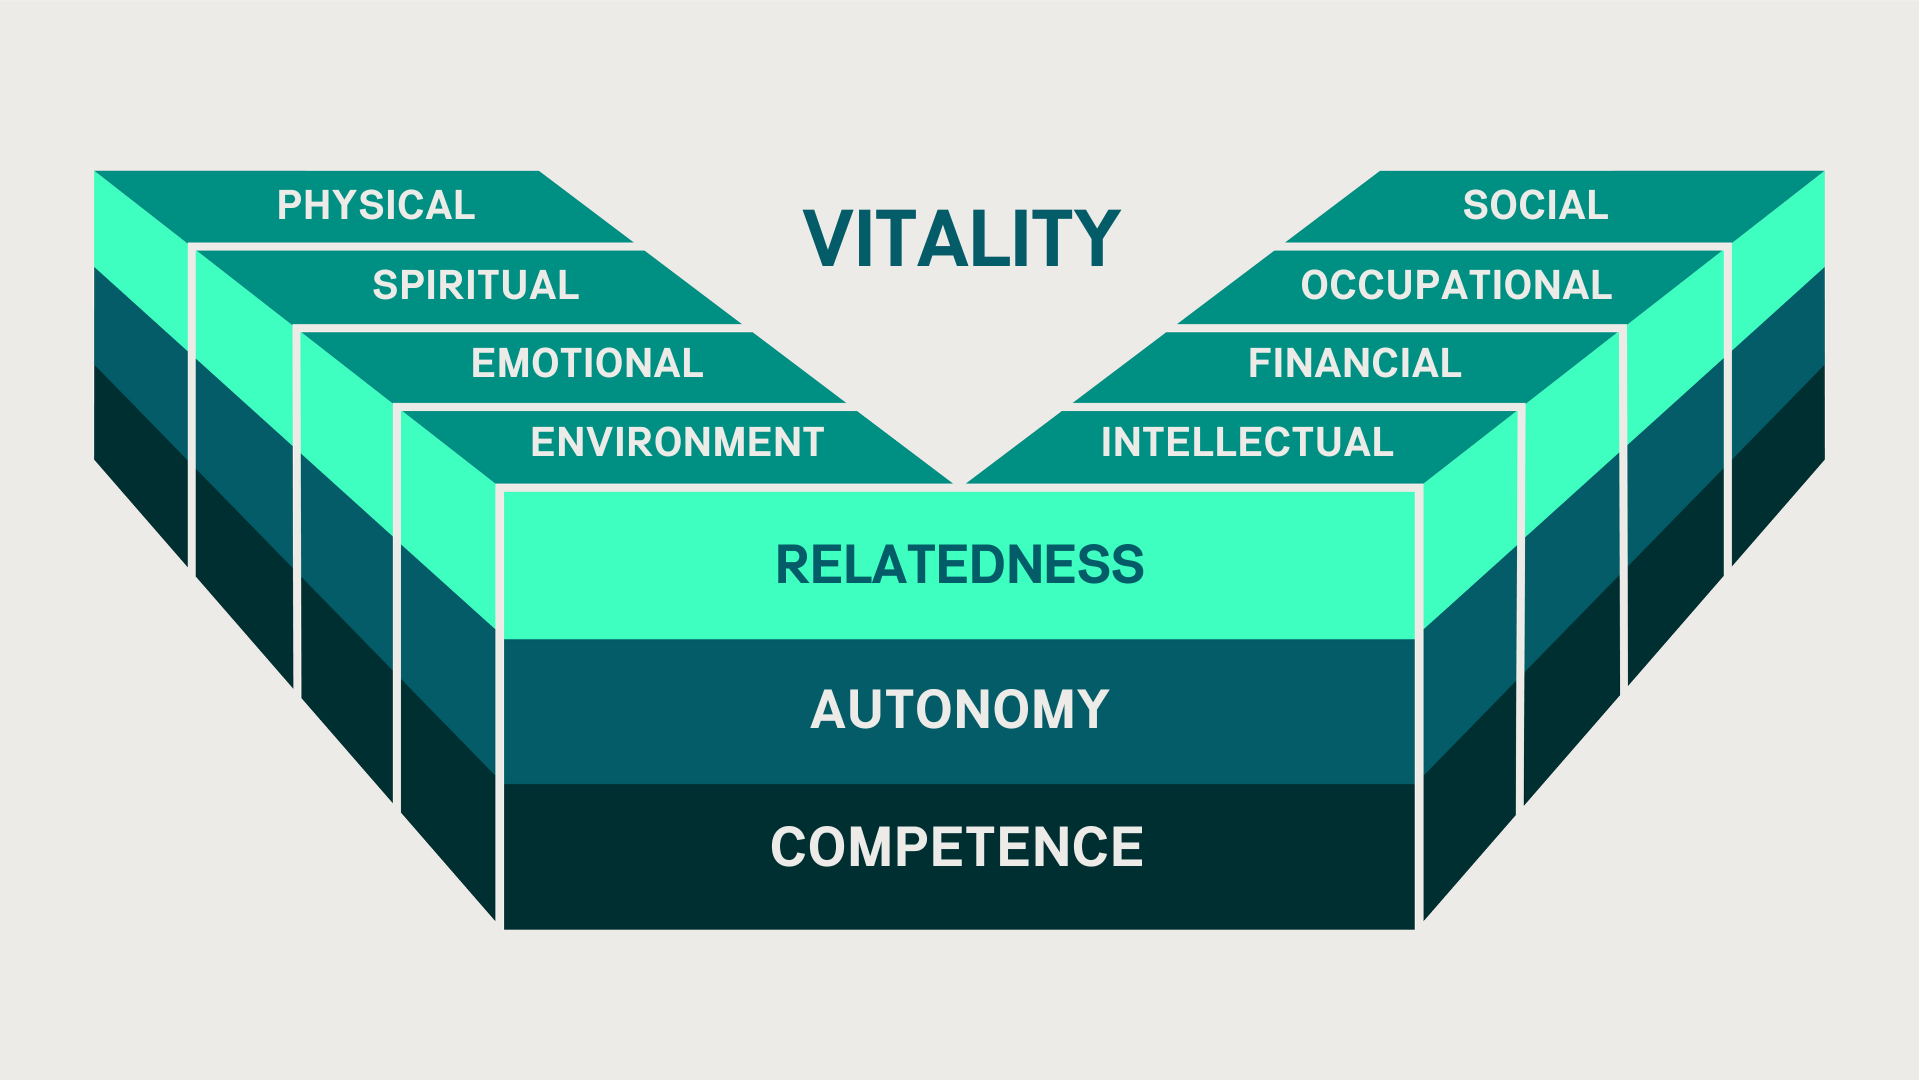
The Cigna Group developed the EVI in 2022 in partnership with psychologist Dr. Richard Ryan, an expert on the science of human motivation and vitality. This first-of-its-kind measure builds upon decades of academic theory and other data to measure people’s perceived ability to make choices and engage willingly, develop skills and capacities, and connect to others across eight domains that impact their vitality: emotional, environmental, financial, intellectual, occupational, physical, social, and spiritual.
To study its value and validity, we piloted the EVI this year with a larger employer. We surveyed its workforce of more than 3,000 employees who have been enrolled in health plan coverage for at least 12 months. The data from this new study was analyzed independently and correlated with other available employee data to provide unique insights into workforce health, vitality, and productivity. It was also compared to the employed general population from the 2022 Evernorth Vitality Index study. This work confirmed the EVI’s ability to provide unique population health insights.
Proving the value of the EVI
The EVI generates a vitality score ranging from 0-100 that allows for segmentation and comparisons. High vitality is categorized as scores from 87-100, medium vitality is 48-86, and low vitality is 0-47. The average vitality score in this workforce’s employee population (as part of our pilot) was seven points higher than the average of the U.S. general working population, providing a benchmark and insights into how this population is doing compared to the general workforce.
Among both data sets, we found vitality scores to be strongly associated with key workforce engagement measures. People with high vitality are more present, more productive, and perform better. In contrast, low levels of vitality are associated with higher absenteeism, poorer work quality, higher turnover, and workplace dissatisfaction.
By measuring vitality levels, employers gain data and insights that can help them more deeply understand the unique needs of their workforce to maximize investments in health and well-being education, benefits, and programs.
The EVI can identify employee groups that need greater or differentiated support
In the pilot population, employees in customer-facing roles, including customer service professionals and those delivering clinical care, had the lowest vitality scores across more than 20 job functions. Human resources and sales had the highest vitality scores. To help us better understand the factors impacting vitality, we looked more closely at the data of those in clinical roles, comparing individuals with the top 20% and the lowest 20% of vitality scores. This enabled a comprehensive look at the current state of the two groups and revealed opportunities for targeted engagement, providing an increased likelihood of meaningful interventions and progress.
The EVI can give insight into employee-manager relationships and identify opportunities for improvement
The impact of work relationships on health, vitality, and productivity is clear, as most employees with high vitality report strong relationships with their managers across related measures. The EVI can provide unique insights into employee-manager relationships and, when combined with other available data such as employee survey results, it can provide a comprehensive picture of opportunities for improvement.
In the pilot employee population, vitality scores averaged 10 points higher for employees with positive manager relationships than those with poor manager relationships (80 vs 70). Those with high vitality were also more than 20 points more likely to be very satisfied with their job (85 vs 62). The importance of manager relationships was evident in the lower vitality of clinical roles as well, where 60% of those with the highest vitality reported strong manager relationships compared to the 39% with the lowest vitality. The trend continues across several factors, providing valuable information that can inform investments in manager training, development programs, and more.
The EVI can inform investments in workforce health and impact
Looking at the drivers within each dimension of health, the EVI provides deeper insights into targeted actions and interventions that may be able to move population level improvements.
Consistent health behavior trends are evident in both the employee pilot and general population data. For example, the importance of quality sleep was clear in both populations. Among the working general population, those who frequently wake up feeling well rested had significantly higher vitality than those who rarely do. In the employee pilot population, a 30-point difference separated the two groups. Employees who wake up feeling well rested have an average vitality score of 90, compared to a score of 61 for those who rarely do. Nutrition is another important factor. Employees with better eating habits average higher vitality (81) than those with poor eating habits (68).
Broadly, at the pilot population level, the EVI identified that the physical and emotional dimensions are the biggest drivers of vitality. They were also two of the lowest scoring dimensions in this population. Therefore, investments in physical and emotional health are likely to have the biggest impact on overall vitality.
The results also identified a strong correlation between resiliency and vitality. Employees who responded “very true” to the statement “I am able to adapt when changes occur” have an average vitality score of 86, while those who responded “not at all true” have an average vitality score of 47.5.
In addition, the data showed that higher vitality scores are associated with an increased likelihood of seeing a clinician for a preventive care visit. For each 1-point increase in vitality, employees were 1.2% more likely to have had a preventive care visit, after adjusting for age and the presence of at least one chronic disease.
The EVI can help identify the highest value population health investments and predict costs
By appending medical claims data to EVI data, we can identify the association between chronic conditions and vitality. Diagnoses of depression and anxiety, asthma, diabetes, prediabetes, and obesity were associated with lower vitality.
Lower vitality also is associated with higher total medical costs. For each 1-point drop in vitality, employees had $45.31 higher total medical costs, even after adjusting for age. Further, employees with over $30,000 in yearly total medical costs had, on average, a 3-point lower vitality score, even after adjusting for age.
A reliable measure of whole-person health
Our research shows the EVI is a reliable measure of whole-person health that can provide meaningful and practical insights about an employee population. It can assess health and well-being, identify populations at risk, and ultimately, inform investments in workforce health and engagement. For optimal insights, EVI data can be combined with other accessible workforce data such as the availability and utilization of health and wellness programs, medical and pharmacy claims, and demographic data such as age, gender, job function, and tenure.
We believe vitality is a catalyst for growth. Individuals striving to achieve their best inspire a ripple effect that enables healthier, more engaged families, workplaces, and communities. We’re continuing to test and learn from the EVI as we explore opportunities to better serve our clients, customers, employees, and other stakeholders.


